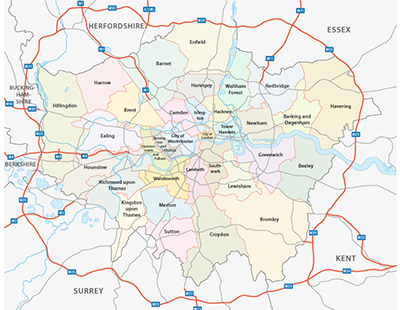
A flat-share website claims typical rents in some 38 per cent of London are now so high they render the areas “uninhabitable” for average tenants.
Ideal Flatmate has based its claim on research looking at the average monthly income after tax for the residents in each borough excluding the City of London. It then calculated notional expenditure, including the the cost of renting a one bedroom flat, a travel ticket, a basic food budget, utilities, council tax and telecoms charges.
The data shows that the cost of living in London accounts for all, or more, of the money on offer for these average-paid tenants in 12 out of 32 London boroughs, with a further 13 seeing the cost of living - as measured by the site - account for 90 per cent or more of the average wage.
Perhaps unsurprisingly Kensington and Chelsea is the most expensive with what the website calls “a basic cost of living” of £2,452 a month, which is 117 per cent of the average monthly net pay in the borough.
Brent is close behind on 116 per cent, while Hackney, Hounslow, Enfield, Newham, Camden, Ealing, Haringey, Barnet, Waltham Forest and Barking and Dagenham are all also home to a cost of living that accounts for all, or more, of the average monthly earnings for those in the borough.
“While Brexit uncertainty has seen a slow in the sales market, we’ve continued to see the level of London rents climb by nearly five per cent on an annual basis” claims Ideal Flatmate co-founder Tom Gatzen.
You can see the website's data below.
|
Borough
|
Wage
|
Rent
|
Travel
|
Food
|
Utilities
|
Council Tax
|
Internet
|
Total
|
Pay Percentage
|
|
Kensington and Chelsea
|
£2,102
|
£1,950
|
£135
|
£30
|
£146
|
£113
|
£77
|
£2,452
|
117%
|
|
Brent
|
£1,587
|
£1,250
|
£194
|
£30
|
£146
|
£151
|
£77
|
£1,849
|
116%
|
|
Hackney
|
£1,793
|
£1,495
|
£158
|
£30
|
£146
|
£138
|
£77
|
£2,046
|
114%
|
|
Hounslow
|
£1,740
|
£1,300
|
£247
|
£30
|
£146
|
£147
|
£77
|
£1,948
|
112%
|
|
Enfield
|
£1,585
|
£1,100
|
£247
|
£30
|
£146
|
£157
|
£77
|
£1,757
|
111%
|
|
Newham
|
£1,585
|
£1,200
|
£158
|
£30
|
£146
|
£127
|
£77
|
£1,739
|
110%
|
|
Camden
|
£2,008
|
£1,582
|
£135
|
£30
|
£146
|
£150
|
£77
|
£2,121
|
106%
|
|
Ealing
|
£1,704
|
£1,200
|
£158
|
£30
|
£146
|
£145
|
£77
|
£1,757
|
103%
|
|
Haringey
|
£1,772
|
£1,250
|
£158
|
£30
|
£146
|
£159
|
£77
|
£1,821
|
103%
|
|
Barnet
|
£1,741
|
£1,150
|
£230
|
£30
|
£146
|
£150
|
£77
|
£1,784
|
102%
|
|
Waltham Forest
|
£1,721
|
£1,075
|
£230
|
£30
|
£146
|
£163
|
£77
|
£1,722
|
100%
|
|
Barking and Dagenham
|
£1,585
|
£950
|
£230
|
£30
|
£146
|
£150
|
£77
|
£1,585
|
100%
|
|
Harrow
|
£1,746
|
£1,050
|
£247
|
£30
|
£146
|
£170
|
£77
|
£1,721
|
99%
|
|
Southwark
|
£1,885
|
£1,300
|
£158
|
£30
|
£146
|
£134
|
£77
|
£1,846
|
98%
|
|
Tower Hamlets
|
£1,990
|
£1,430
|
£135
|
£30
|
£146
|
£129
|
£77
|
£1,948
|
98%
|
|
Westminster
|
£2,367
|
£1,842
|
£135
|
£30
|
£146
|
£72
|
£77
|
£2,302
|
97%
|
|
Islington
|
£2,152
|
£1,517
|
£158
|
£30
|
£146
|
£144
|
£77
|
£2,073
|
96%
|
|
Lewisham
|
£1,782
|
£1,100
|
£194
|
£30
|
£146
|
£151
|
£77
|
£1,699
|
95%
|
|
Hillingdon
|
£1,729
|
£1,000
|
£247
|
£30
|
£146
|
£142
|
£77
|
£1,642
|
95%
|
|
Merton
|
£1,900
|
£1,200
|
£194
|
£30
|
£146
|
£150
|
£77
|
£1,798
|
95%
|
|
Greenwich
|
£1,842
|
£1,150
|
£194
|
£30
|
£146
|
£144
|
£77
|
£1,742
|
95%
|
|
Lambeth
|
£1,970
|
£1,300
|
£158
|
£30
|
£146
|
£140
|
£77
|
£1,852
|
94%
|
|
Redbridge
|
£1,791
|
£990
|
£230
|
£30
|
£146
|
£156
|
£77
|
£1,630
|
91%
|
|
Kingston upon Thames
|
£1,987
|
£1,100
|
£247
|
£30
|
£146
|
£181
|
£77
|
£1,782
|
90%
|
|
Sutton
|
£1,754
|
£925
|
£230
|
£30
|
£146
|
£161
|
£77
|
£1,571
|
90%
|
|
Hammersmith and Fulham
|
£2,135
|
£1,400
|
£135
|
£30
|
£146
|
£103
|
£77
|
£1,892
|
89%
|
|
Richmond upon Thames
|
£2,127
|
£1,200
|
£247
|
£30
|
£146
|
£172
|
£77
|
£1,872
|
88%
|
|
Croydon
|
£1,783
|
£900
|
£247
|
£30
|
£146
|
£165
|
£77
|
£1,565
|
88%
|
|
Havering
|
£1,762
|
£875
|
£247
|
£30
|
£146
|
£167
|
£77
|
£1,542
|
88%
|
|
Bexley
|
£1,679
|
£800
|
£247
|
£30
|
£146
|
£160
|
£77
|
£1,460
|
87%
|
|
Wandsworth
|
£2,159
|
£1,365
|
£158
|
£30
|
£146
|
£75
|
£77
|
£1,852
|
86%
|
|
Bromley
|
£2,002
|
£950
|
£247
|
£30
|
£146
|
£146
|
£77
|
£1,597
|
80%
|
|
Rental data sourced: Mayor of London
|
|
Average earnings data sourced: ONS
|
|
Average council tax for each borough sorced: KFH
|
|
Other costs of living sourced: ONS
|
*Some figures have been rounded up or down and the average rent given is for a one-bed property


%20-%20IMAGE%20Client%20Accounting%20%E2%80%93%20what%20are%20your%20options.jpg)


.png)
%20(002).png)

%20(002).jpg)


Join the conversation
Jump to latest comment and add your reply
Wow,
Coincidentally well-timed for the Fitness ( sic ) for Habitation Act on 20/3/19
The country will need to Triple its No-win, No-fee solicitors and Quadruple the Income Tax we all pay to fund the Legal Aid claims.
Misleading title to this article. How how can you declare a property uninhabitable based on the rent asked????
NOTE TO SELF: If you want to live Kensington & Chelsea and only earn £2,102 don't rent a flat for £1,950 or get a better paid job.
Please login to comment